Dashboard Overview
The dashboard provides an overview of overall analytics, calendar overview, and tables with campaigns information.
Multiple companies
Phishing Club can be run as a multi-tenant setup. When not viewing as a company, this is called
Shared view.
In Shared view the dashboard displays data across all client organizations, while
company view shows data specific to the selected organization.
Score cards
The score cards gives a quick overview of active, scheduled, completed campaigns and repeat offenders. Any score card can be clicked to navigate to more detailed view.

| Metric | Description |
|---|---|
| Active Campaigns | Number of campaigns currently running and accepting interactions |
| Scheduled Campaigns | Number of campaigns scheduled to launch in the future |
| Completed Campaigns | Number of campaigns that have finished and are no longer recording results |
| Repeat Offenders | Number of recipients flagged as repeat offenders based on configured thresholds |
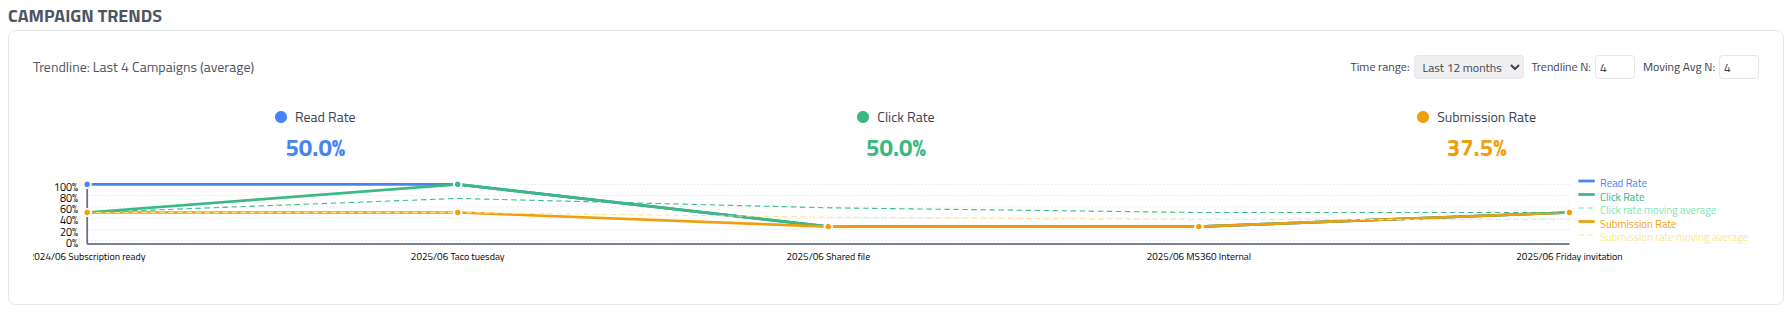
Trendline
The trendline gives a visual representation of campaign analytics, including open rates, click rates, submission rates, and reporting rates.
It is recommended not to use campaign metrics as a single indicator if phishing risk has been reduced or if awareness training is having an effect. Different phishing campaigns have different results and can not be easily compared.
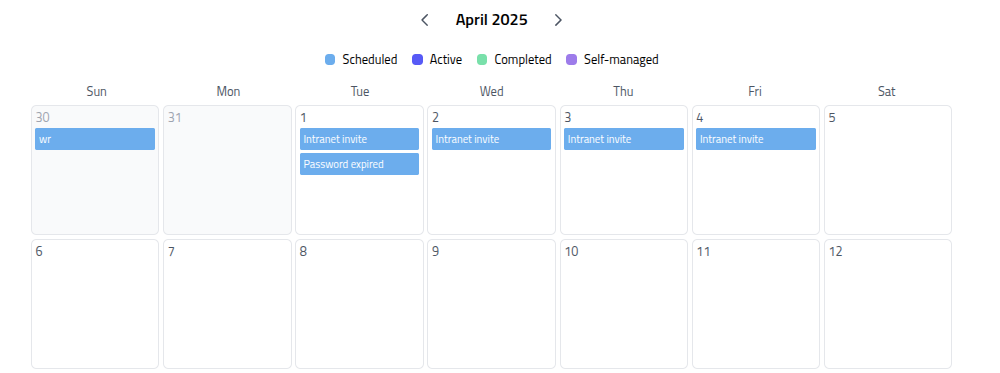
Calendar
The calendar provides a visual timeline of all your campaigns, making it easy to coordinate scheduling and avoid conflicts. This view helps you maintain a campaign schedule and plan future activities.
Calendar Features
- Direct Navigation: Click on any campaign to navigate to its view
- Visual Planning: See campaign overlap and spacing
- Quick Reference: Identify campaign types and statuses by visual indicators
Calendar Filters
Use the filter toggles to customize your calendar view:
Scheduled- Show campaigns planned for future executionActive- Display currently running campaignsCompleted- Include finished campaigns for referenceSelf-managed- Show campaigns with manual delivery control
Tables
The dashboard provides three tables that organize your campaigns by status, offering information and access to campaign management functions.
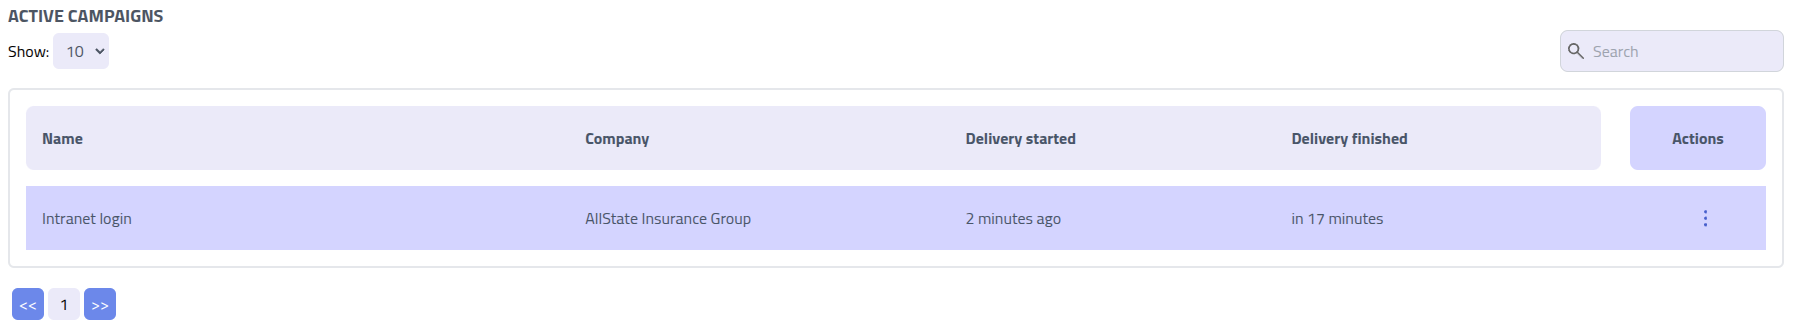
Active Campaigns
This table displays campaigns that are currently running and recording user interactions. These campaigns can receive new events and generate analytics.
Scheduled Campaigns
View campaigns that are configured and ready to launch but have future start dates. This helps you prepare for upcoming activities and manage your simulation pipeline.

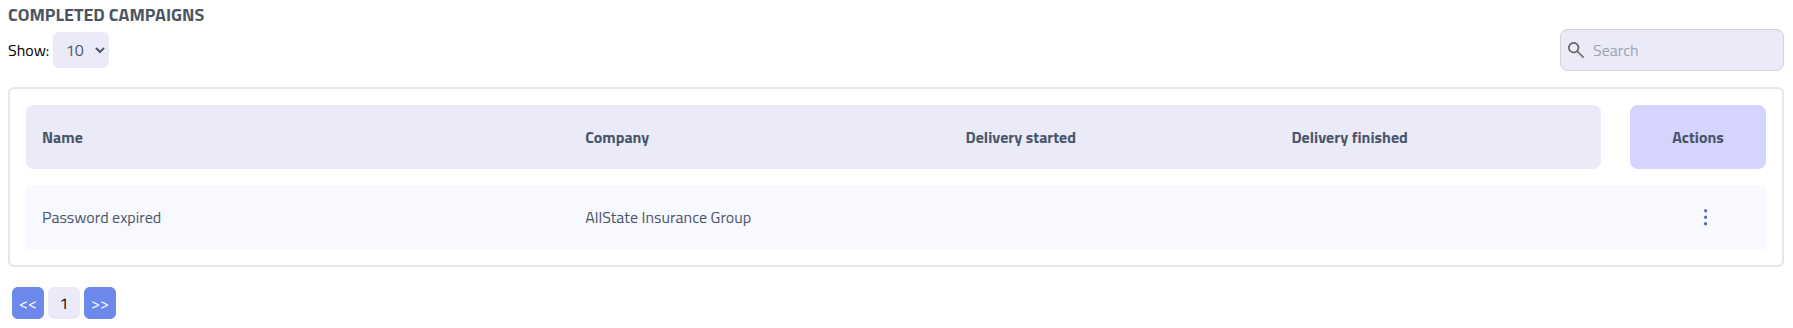
Completed Campaigns
Access data from campaigns that have finished execution. These campaigns no longer accept new interactions but retain all collected data for analysis and reporting.
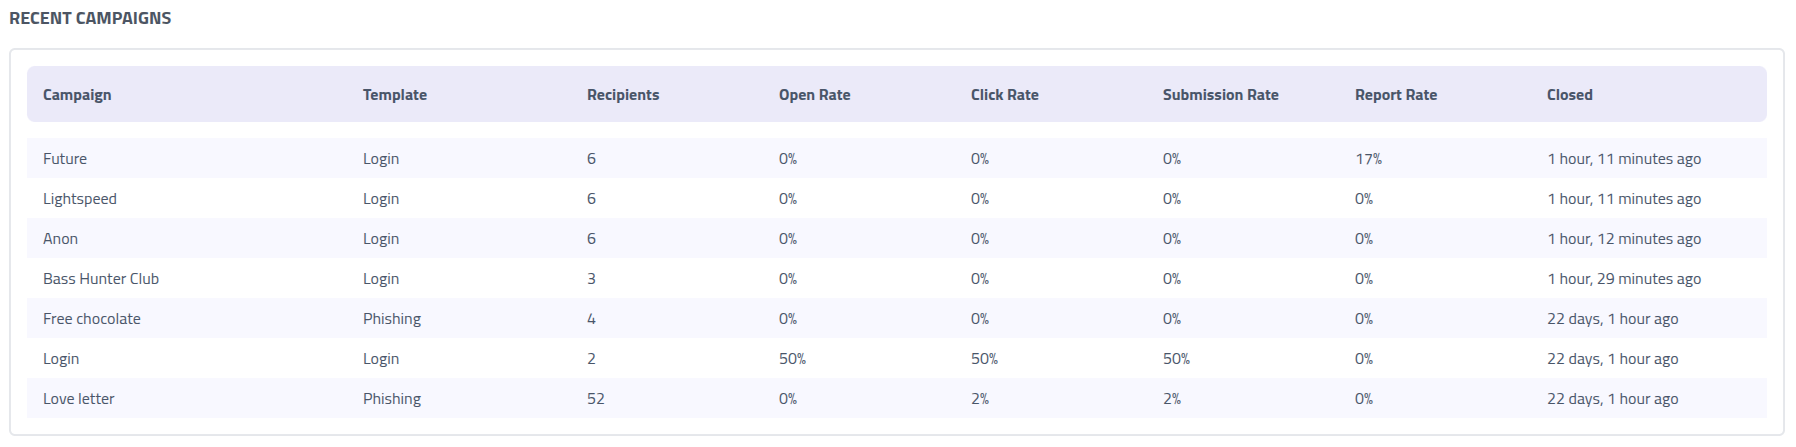
Recent Campaigns
Shows the metrics of finished campaigns.